
If you have ever tried to research a stock seriously, you know how quickly the work becomes overwhelming.
You may start with the company’s revenue and earnings, then move to debt, free cash flow, competitors, valuation, industry trends, analyst opinions, and recent news. Before long, you have dozens of browser tabs open and a spreadsheet full of numbers.
Professional investors have Bloomberg Terminal and other expensive financial-data platforms to bring much of this information together. But individual investors now have another option: Gemini and Google’s AI-powered finance tools.
Google’s newer Google Finance experience can provide AI-powered research on individual stocks and broader market questions, compare bullish and bearish views, surface financial reports, and use Deep Search for more complex research. Google says the updated experience has expanded to more than 100 countries, including Japan.
That doesn’t mean Gemini magically becomes a professional portfolio manager. AI can still make mistakes, use incomplete information, or misunderstand financial data.
But with the right prompts, it can dramatically speed up the research process.
Here are eight prompts I would use as a starting framework for analyzing almost any stock.
Before You Start: Give Gemini the Right Stock Information

Don’t simply type:
Analyze Apple stock.That’s too vague.
Whenever possible, give Gemini the company’s ticker symbol and exchange.
For example:
Analyze NASDAQ:AAPL.This is particularly useful because ticker symbols can overlap across different markets. Google also recommends including the exchange symbol when using its Google Finance functions to reduce ambiguity.
For a Japanese stock, you could use something such as:
Analyze TSE:7203 (Toyota Motor).You can then ask follow-up questions instead of starting a completely new conversation.
1. Full Wall Street-Style Stock Analysis
This is the prompt I would start with.
Prompt
Act as a senior equity research analyst.

Analyze this stock: [TICKER]

Provide a structured investment research report covering:

1. Business model and major revenue sources
2. Competitive advantages and economic moat
3. Industry trends and market structure
4. Financial health, including revenue growth, margins, profitability, and debt
5. Key risks
6. Valuation compared with major competitors
7. Bull, base, and bear scenarios
8. 12-24 month outlook

Use the latest reliable information available.

Clearly distinguish verified financial data from estimates or assumptions.

Explain the analysis in plain English, but maintain professional financial-analysis standards.
The important part here is “distinguish verified financial data from estimates or assumptions.”
Without that instruction, an AI model can present an assumption with the same confidence as an audited number.
Google Finance itself now provides AI-generated insights around recent performance, market sentiment, financial reports, and bullish/bearish views, making this type of research workflow increasingly practical.
2. Analyze Five Years of Financial Statements
A stock can look exciting while its underlying business is deteriorating.
That’s why I like to separate the financial analysis from the broader investment story.
Prompt
Analyze the most recent five years of financial statements for [COMPANY/TICKER].

Focus on:

- Revenue growth
- Net income trend
- Free cash flow
- Gross and operating margins
- Debt levels
- Return on equity
- Operating cash flow
- Capital expenditures

Create a year-by-year comparison where reliable data is available.

Identify the major changes and explain what caused them.

Finally, classify the company's financial condition as:

1. Improving
2. Stable
3. Mixed
4. Deteriorating

Do not invent missing figures. Clearly identify estimates or unavailable data.
This is much more useful than simply asking whether a company is “financially healthy.”
You want Gemini to identify direction, not just a snapshot.
For example, a company with rising revenue but falling free cash flow deserves a very different analysis from one where both revenue and cash generation are improving.
Google Finance also provides access to earnings information, previous reports, related earnings, transcripts, and official filings within its research experience.
3. Find the Company’s Economic Moat
Revenue and earnings tell you what a company has achieved.
The economic moat helps answer a different question:
Why can’t competitors easily take that business away?
Prompt
Evaluate the economic moat of [COMPANY].

Analyze these areas:

- Brand strength
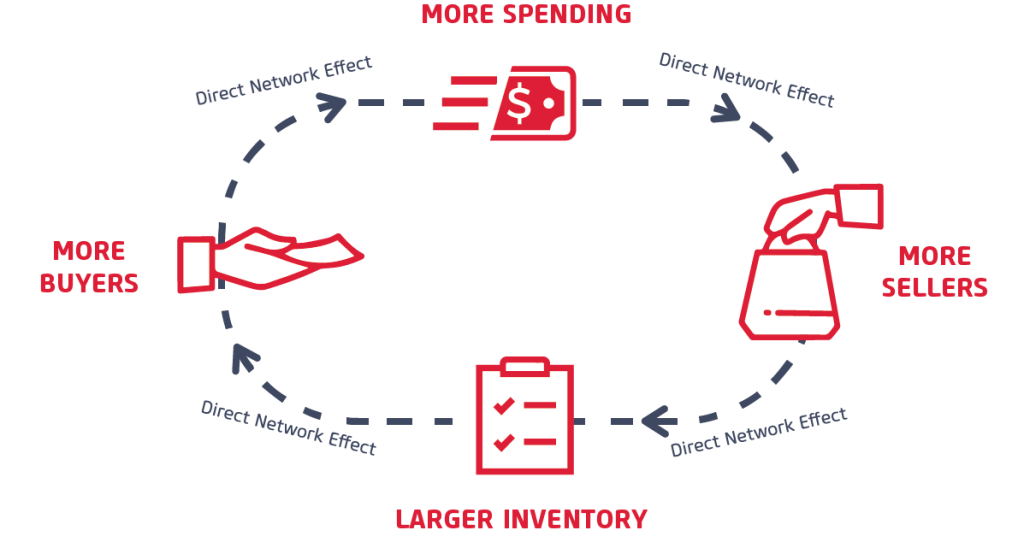
- Network effects
- Switching costs
- Cost advantages
- Patents and proprietary technology
- Distribution advantages
- Customer loyalty

Compare the company with its three most important competitors.

Score each moat category from 1 to 10.

Then provide:

- Overall moat score
- Strongest competitive advantage
- Weakest competitive advantage
- Whether the moat is expanding, stable, or shrinking

Support the analysis with specific evidence rather than generic statements.
This is one of my favorite prompts because it forces the analysis away from simply looking at the stock price.
A great company isn’t necessarily a great investment at any price.
And a company with a strong brand isn’t automatically protected from competition.
The key question is whether its advantages actually translate into pricing power, higher returns, customer retention, or sustainable cash generation.
4. Analyze the Stock’s Valuation
This is where many individual investors make mistakes.
A good company can still be an expensive stock.
Prompt
Perform a valuation analysis of [TICKER].

Include:

- Current P/E ratio
- Forward P/E if reliable data is available
- Price-to-sales ratio
- Price-to-free-cash-flow ratio
- Comparison with major competitors
- Historical valuation range
- Industry average valuation
- A simplified DCF valuation

For the DCF:

1. State all assumptions
2. Show the estimated revenue or free-cash-flow growth rate
3. State the discount rate
4. State the terminal growth rate
5. Calculate an estimated fair value range

Then explain whether the stock appears undervalued, fairly valued, or overvalued under the stated assumptions.

Do not present the DCF result as a precise prediction.
The final sentence is particularly important.
A DCF isn’t a crystal ball.
If you change the growth rate or discount rate slightly, the estimated fair value can change substantially.
So instead of asking:
“What is the exact fair price?”
ask:
“What range of values is reasonable under different assumptions?”
That’s a much more useful way to think about valuation.
5. Identify the Biggest Risks
Investors often spend too much time looking for reasons to buy a stock.
Try asking Gemini to make the opposite case.
Prompt
Identify the biggest risks of investing in [COMPANY/TICKER].

Analyze:

- Macroeconomic risks
- Industry disruption
- Competitive threats
- Regulatory risks
- Debt and financial risks
- Supply-chain risks
- Technology risks
- Management risks
- Geographic or geopolitical risks

Rank the risks from highest to lowest.

For each risk, explain:

1. What could happen
2. Why it matters
3. What financial impact it could have
4. What evidence would indicate the risk is becoming more likely
5. Whether the risk is short-term or long-term
This changes the conversation from:
“Why should I buy it?”
to:
“What would make my investment thesis wrong?”
That’s a much healthier investment-research habit.
6. Analyze Long-Term Growth Potential
The next question is what could happen over the next five to ten years.
Prompt
Analyze the long-term growth potential of [COMPANY/TICKER] over the next 5-10 years.

Consider:

- Total addressable market
- Industry growth rate
- Market share
- Geographic expansion
- New products
- Pricing power
- AI or technology advantages
- Potential acquisitions
- Capital requirements
- Major growth constraints

Create three scenarios:

Bear case
Base case
Bull case

For each scenario, estimate a reasonable annual growth range and explain the assumptions behind it.

Do not present the estimates as guaranteed outcomes.
This is where scenario analysis becomes much more useful than a single price target.
For example:
| Scenario | Key assumption |
|---|---|
| Bear | Competition increases and growth slows |
| Base | Current strategy continues successfully |
| Bull | New markets and products accelerate growth |
You can then ask Gemini to challenge the assumptions behind each scenario.
7. Think Like an Institutional Investor
This prompt changes the perspective completely.
Instead of asking whether the stock is “good,” ask why a professional fund might buy or avoid it.
Prompt
Act as a hedge fund portfolio manager evaluating [TICKER].

Answer the following:

1. Why might institutional investors buy this stock?
2. Why might institutional investors avoid it?
3. What are the three most important variables that could change the investment thesis?
4. What would make the stock attractive at today's valuation?
5. What would make the stock unattractive?
6. What would you monitor over the next four quarters?

Then write a concise investment thesis with:

- Bull case
- Bear case
- Key catalyst
- Biggest risk
- Valuation concern
- Most important metric to monitor
This is particularly useful after you’ve already run the first six prompts.
You’re no longer simply collecting information.
You’re trying to build an actual investment thesis.
8. Make Two Analysts Debate the Stock

Finally, make Gemini argue with itself.
Prompt
Create a debate between two professional equity analysts analyzing [TICKER].

Analyst A is bullish.

Analyst B is bearish.

The bullish analyst must provide evidence supporting the investment thesis.

The bearish analyst must identify weaknesses, valuation risks, competitive threats, and potential downside.

Neither analyst should use emotional language or unsupported claims.

After the debate, act as a neutral senior analyst and provide:

1. Strongest bullish argument
2. Strongest bearish argument
3. Evidence both sides agree on
4. Key unresolved question
5. What future data would change the conclusion

End with a balanced assessment rather than a simple Buy or Sell recommendation.
This is probably the prompt I’d use after running the other seven.
You’ve already collected the financial data, valuation, risks, competitive position, and growth assumptions.
Now you can pressure-test the entire thesis.
A Better Workflow: Use the 8 Prompts as One Research Process
Don’t paste all eight prompts into Gemini at once.
Use them sequentially:
Step 1 → Full company analysis
Step 2 → Financial statements
Step 3 → Economic moat
Step 4 → Valuation
Step 5 → Risks
Step 6 → Growth
Step 7 → Institutional perspective
Step 8 → Bull vs. bear debate
Then ask one final question:
Based on the analysis above, identify the three most important facts I should verify independently before making an investment decision.

For each fact, provide the original source I should check.
That’s an important final step.
Gemini’s Deep Research can perform real-time research using Google Search and other selected sources, and Google says Deep Research reports can take several minutes because they analyze multiple sources.
Google Finance’s newer research tools can also surface official filings, earnings information, transcripts, news, and AI-generated summaries.
Common Mistakes and Troubleshooting
Mistake 1: Treating Gemini’s answer as financial advice
Gemini can help organize information and build an investment-research framework.
It cannot guarantee that a stock will rise.
Never treat an AI-generated fair value or price target as a certainty.
Mistake 2: Using an ambiguous ticker
Don’t simply enter:
Analyze 7203.Use:
Analyze TSE:7203 (Toyota Motor).The exchange matters, especially when researching companies outside the United States.
Mistake 3: Trusting old financial numbers
Financial data changes after earnings releases, filings, acquisitions, buybacks, and other corporate events.
For important numbers, ask:
Use the latest available financial information and provide the date and source for each important figure.Then verify critical figures against the company’s official filings or investor-relations materials.
Mistake 4: Asking for an exact stock price target
A better request is:
Give me a reasonable valuation range under bear, base, and bull assumptions.This forces the model to show the assumptions behind the number.
Mistake 5: Asking Gemini only for reasons to buy
This creates confirmation bias.
Always run the risk analysis and bearish analyst prompts.
If you cannot explain why your investment thesis might fail, you probably haven’t researched the company deeply enough.
Final Thoughts
Gemini isn’t a replacement for Bloomberg Terminal, professional financial databases, or a qualified investment adviser.
But that doesn’t make it useless.
Used properly, it can turn a long, messy research process into a structured workflow covering business quality, financial health, competitive advantages, valuation, risks, growth, and opposing viewpoints.
And Google’s financial tools are moving in the same direction. Google Finance now combines market data with AI-powered research, financial reports, earnings information, bullish/bearish analysis, and deeper research tools.
The biggest advantage isn’t getting Gemini to tell you what stock to buy.
It’s getting it to help you ask better questions before you decide.
Important: This article is for educational and research purposes only. AI-generated financial analysis can contain errors, outdated information, or incorrect assumptions. Always verify important financial data against primary sources and make investment decisions based on your own research and risk tolerance.